Query Engine
Getting Started with SQL on the Platform
Coactive enhances Visual Analytics with a SQL interface designed to interact with your visual data, enabling users to perform advanced queries on dynamic tags, concepts, and visual metadata.
This document explains the SQL interface used to query various tables within the Coactive platform. By the end of this guide, your team will be able to leverage Coactive’s SQL capabilities to perform advanced analytics and unlock deeper insights into your visual data.
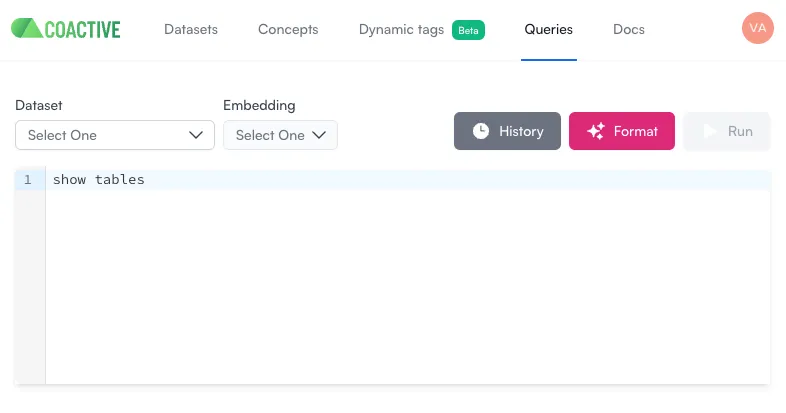
Open the SQL platform
- Navigate to the Queries section from the platform;
- Select the
Datasetyou want to query and the embedding will automatically be selected.
Display available tables
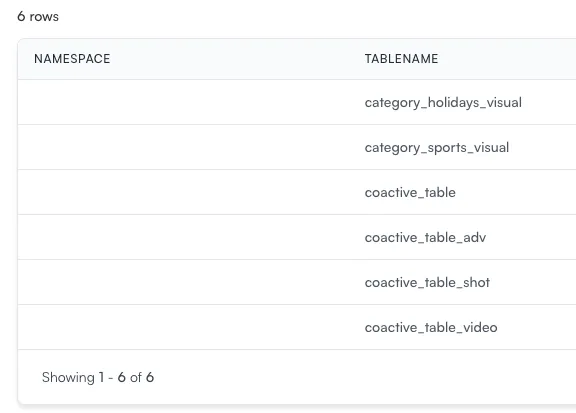
The first step when working with SQL is identifying which tables are available in the platform.
This will list all the tables accessible within your dataset, helping you identify the data resources you can work with.
Retrieve Column Names from a Table
To understand the structure of a specific table, use the DESCRIBE statement.
This query will return all column names and their data types. For example, in coactive_table, you’ll find columns such as coactive_image_id, keyframe_index, path, concept columns, etc.
Understand Data Volume
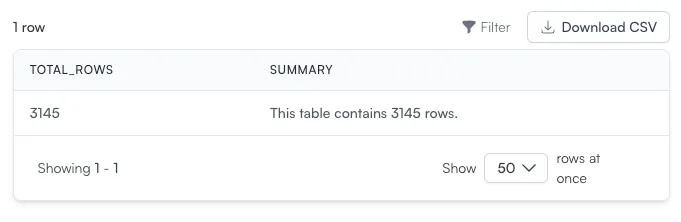
To measure the size of your dataset and estimate query performance, you can count the total number of rows in a table. For larger datasets, it’s often helpful to use a Common Table Expression (CTE) to structure your queries:
- WITH row_count AS: Creates a temporary table to store the total row count for better readability.
- CONCAT: Constructs a human-readable summary to provide clarity on the data volume.
Expected Output: